Bitcoin bulls face increasing pressure as a key momentum indicator signals a significant downturn in the market. The moving average convergence divergence histogram crossed below zero for the third time since October. CoinDesk reported the development alongside the cryptocurrency trading near $70,210.86. This timing coincides with broader uncertainty regarding global economic stability and digital asset regulations in March 2026.
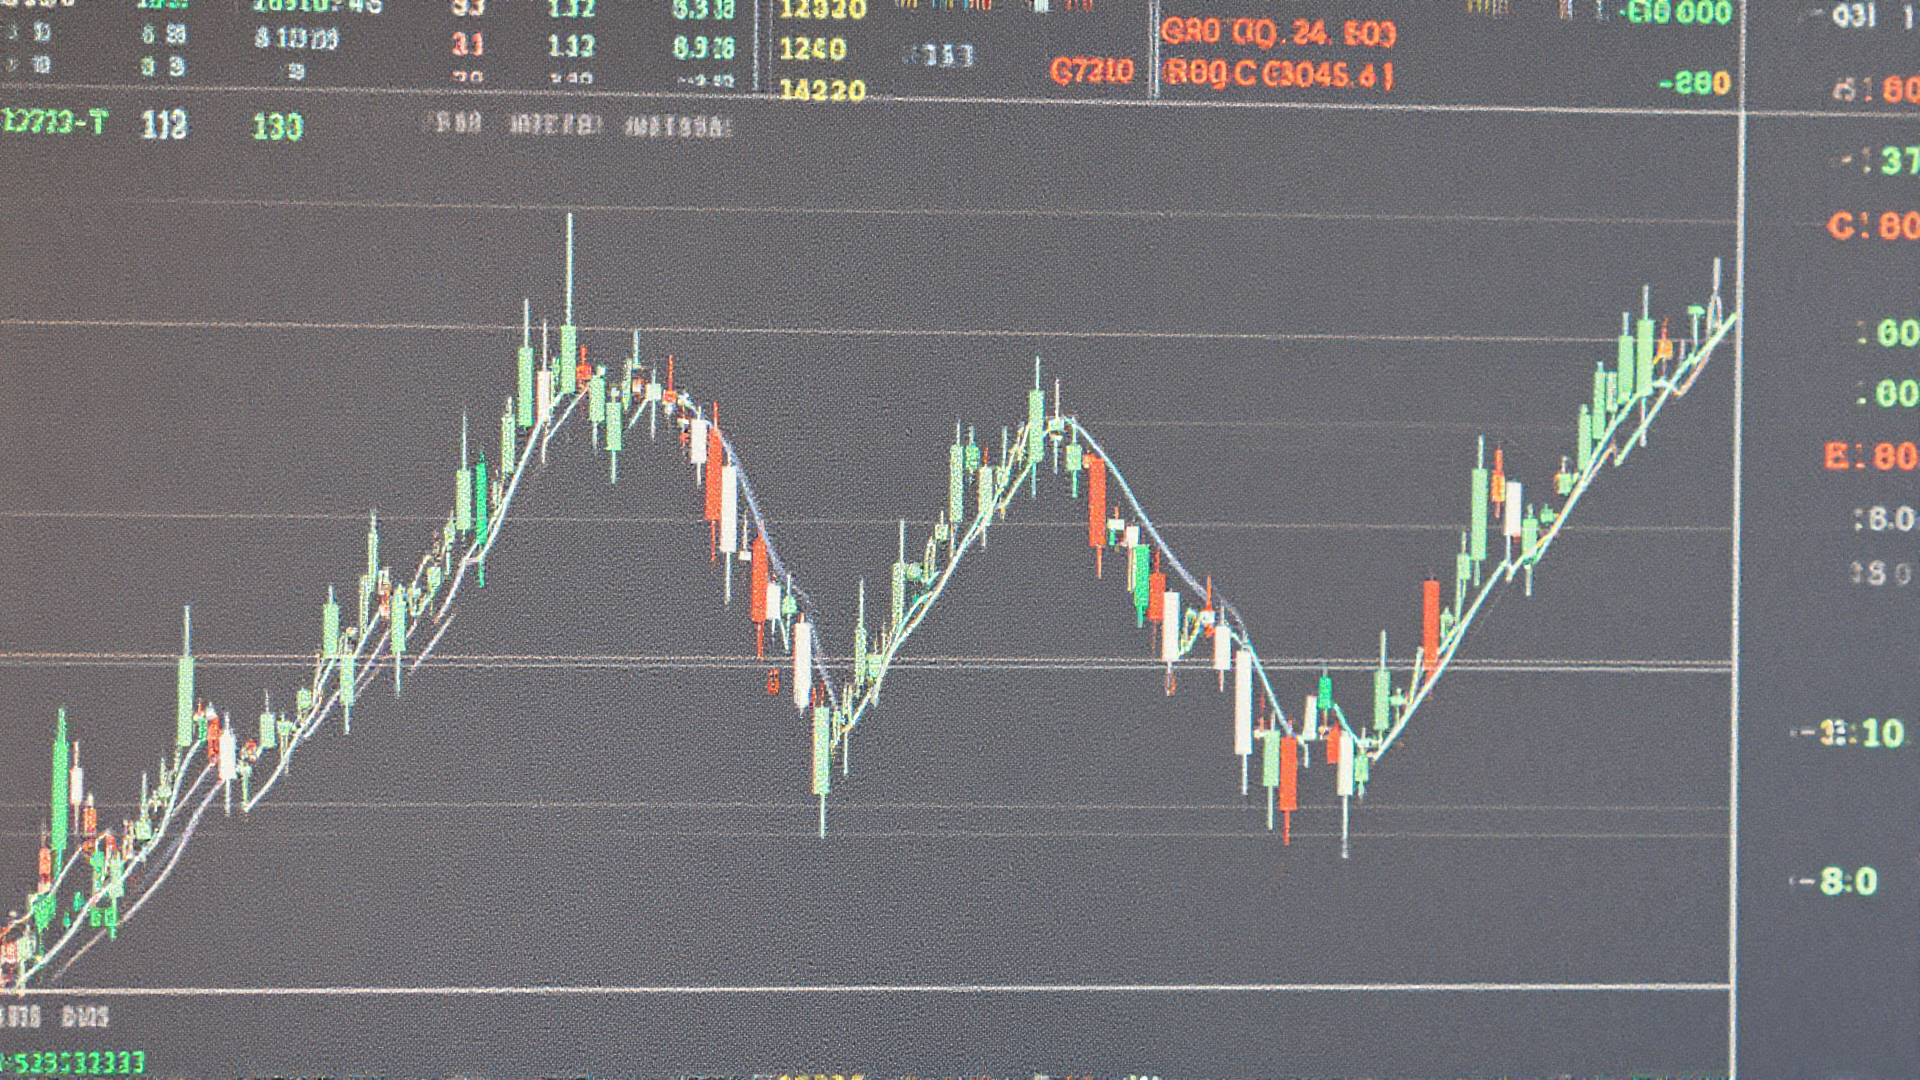
Technical analysis relies on the relationship between two exponential moving averages to gauge trend strength effectively. The MACD line subtracts the 26-day average from the 12-day average to establish baseline momentum. The histogram plots the difference between this line and its nine-day signal average. Traders use these lines to identify changes in the strength of a trend. This calculation filters out minor fluctuations to focus on sustained directional movement.
Historical data suggests this specific metric has been highly predictive of price corrections recently. Bitcoin reached a record high of $126,000 in October before the indicator turned negative. Subsequent crossings aligned with significant declines from $106,000 down to $80,000 in November. This pattern indicates a strong correlation between the indicator and major price movements. Data from the CoinDesk archives confirms this accuracy over the past several months.
A brief recovery followed the initial drop, but the trend reversed again in January. The indicator flashed bearish on Jan. 20 while the asset traded around $90,000. Prices subsequently fell to nearly $60,000 by Feb. 6. Each cycle has demonstrated that bulls struggle to maintain upward momentum for extended periods. The market structure continues to show resistance at previous high levels.
Every bullish crossover since the October peak has resulted in disappointing bounces that fade quickly. Sellers appear to be firmly in control of the market structure during these intervals. The current signal implies another downward shift in momentum is imminent. This suggests that buying pressure might not be sufficient to sustain higher price levels. Institutional flows are not currently supporting a sustained rally attempt.
Broader geopolitical tensions may also impact the asset's stability during this period. Recent reports suggest Bitcoin's resilience during the ongoing conflict with Iran faces stress. External factors could amplify the selling pressure indicated by technical metrics. Market participants must remain vigilant regarding how international events influence capital flows. These tensions add a layer of complexity to the existing technical analysis.
Meanwhile, corporate treasury strategies continue to evolve alongside market volatility. Strategy announced expanded share issuance plans to raise capital from Wall Street partners. This move could increase potential buying power back to $42 billion according to reports. Institutional participation remains a critical component of long-term price discovery. The company aims to leverage this capital to accumulate more assets.
Investors must weigh the high accuracy of past signals against standard market risks. Past performance does not guarantee future results, but the track record remains strong. Traders generally pay heed to such signals rather than ignoring the data. The next few weeks will determine whether the bullish defense holds against the bearish pressure. Risk management strategies should be adjusted accordingly.
Watch for support levels near $60,000 to see if buyers can regain control. Further declines could test the limits of investor confidence in the digital asset class. Analysts suggest monitoring volume to confirm the strength of any breakout attempts. A sustained drop below this threshold could trigger additional automated selling mechanisms. The market will likely consolidate before making a definitive directional move.